2 min readRecRam
Comprehensive Video Form Analytics: Deep Dive into Your Performance Data
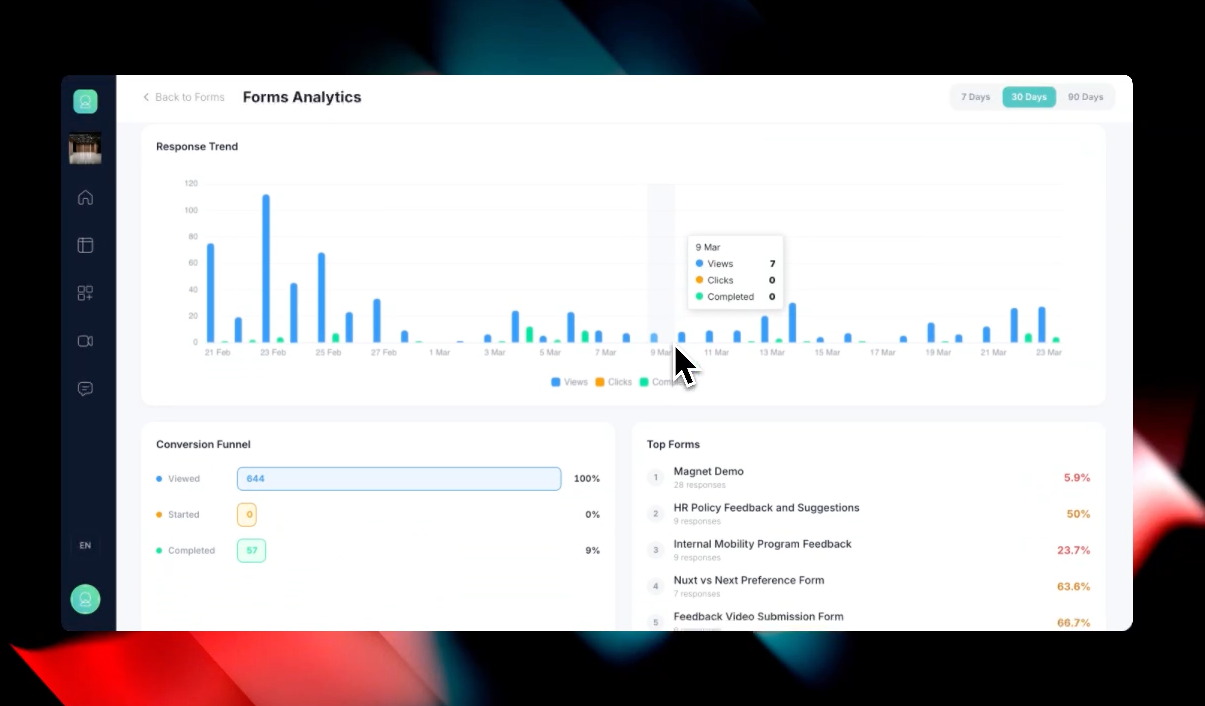
Understanding how your audience interacts with your video-first forms is crucial for improving completion rates. That’s why we are introducing a dedicated Forms Analytics dashboard. You can now track performance, identify drop-off points, and measure the success of your feedback campaigns across all your workspaces from a single, centralized view.
Key Features & Functionalities:
- Global Analytics Dashboard: Accessible via a new “Analytics” button on the Forms page, giving you an aggregate overview of your entire organization’s form performance.
- High-Level KPI Tracking & Time Filters: Filter your data by predefined ranges (7, 30, or 90 days) and get instant visibility into critical metrics:
- Total Views
- Total Responses
- Completed
- Overall Completion Rate
- Average Time Spent
- Interactive Response Trend Chart: A detailed, chronological bar chart tracking Views, Clicks, and Completed actions. You can hover over specific dates to pinpoint exactly when engagement spiked or dropped.
- Conversion Funnel Analysis: Pinpoint exactly where you are losing users. The visual Conversion Funnel tracks the user journey step-by-step from Viewed to Started and finally to Completed, showing precise drop-off percentages.
- Top Forms & Detailed Tabular Breakdown: * Quickly identify your highest-converting campaigns in the Top Forms widget.
- Dive deeper using the comprehensive All Forms table at the bottom, which lists every individual form alongside its specific Workspace, Views, Responses, and Conversion Rate.