RecRam Research · 2026 edition

The State of Multimodal Form Responses 2026

Before a team adds a camera to a form, it asks the same questions: will people record, how long will they talk, and on what device? We studied 8,058 form responses and 1,713 video answers on RecRam to find out.

Published
Sample
8,058 form responses
Scope
Classical RecRam forms
Author
RecRam Research

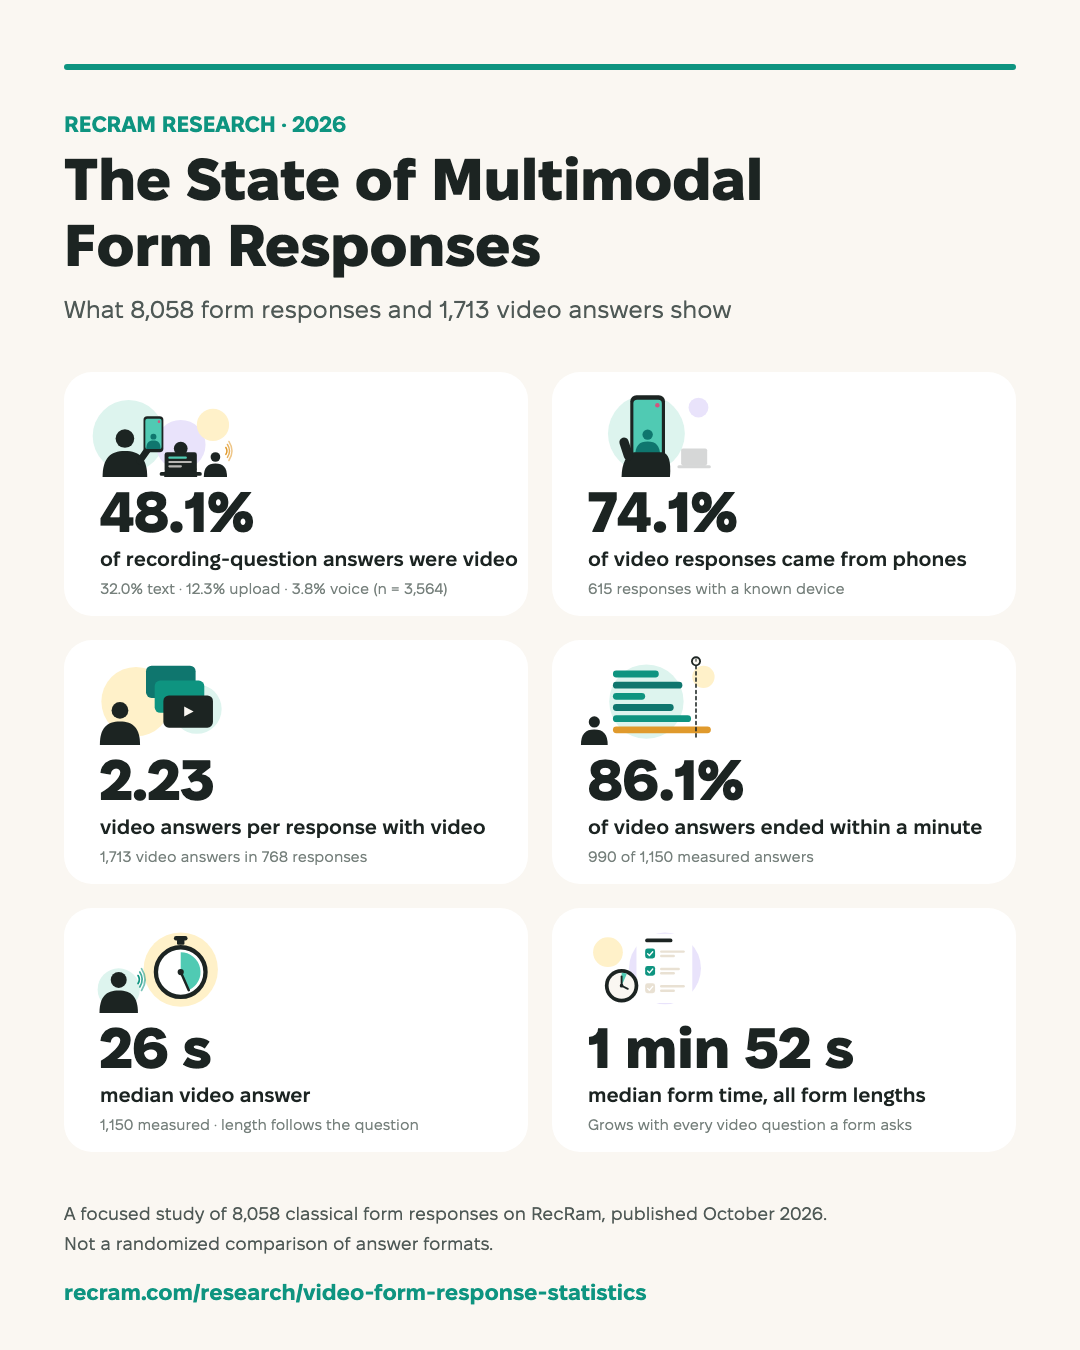
Nearly 1 in 2 answers was a video

48.1%

of 3,564 answers to recording questions were recorded on camera.

  • Video 48.1%
  • Text 32.0%
  • File upload 12.3%
  • Voice 3.8%

74.1%

of video responses came from phones

2.23

video answers in each response with video

Nebi Kara

Nebi Kara

Founder of RecRam · Marketing Specialist

LinkedIn

Foreword

Why we published our own numbers

Before a team adds a video question to a form, the same three questions come up. Will people actually record? How long will they talk? Will it work on a phone? Most answers in circulation are opinions, or numbers nobody can trace back to a source.

We had real answers in our own data, so we counted them carefully, kept every unit straight, and printed each catch next to the number it belongs to. A benchmark is only useful if it still holds up when you build a form around it.

One thing this data cannot measure, and I would still bet on: how you ask shapes what you get back. A question asked on camera, specific enough to answer, invites a fuller reply than a line of text. That is why this report closes with how to ask, not only with what we found.

Use these numbers, challenge them, and tell us what you want measured next. The charts and the data are yours to reuse with a link back.

— Nebi Kara

Key findings

Six questions teams ask about video answers

Each answer below is one sentence you can quote, with the sample it comes from and the one caveat that has to travel with it.

  1. 01When a form lets people record, do they?

    48.1%

    of answers to recording questions were video

    Video accounted for 48.1% of 3,564 answers to recording-type questions in completed RecRam form responses; 32.0% were typed text, 12.3% file uploads and 3.8% voice.

    Observed mix, not a preference test: the options offered differed between forms.

    See the data
  2. 02Do people record on a phone or a computer?

    74.1%

    of video responses came from phones

    Of 615 completed responses containing video where the device could be classified, 74.1% were recorded on a mobile device.

    Device was known for 80.1% of video responses; across all 768, mobile was 59.4%.

    See the data
  3. 03Will people record more than one answer?

    2.23

    video answers per response with video

    The 768 completed responses that contained video held 1,713 video answers between them, an average of 2.23 each.

    An average across answers, so forms with many video questions weigh more.

    See the data
  4. 04Do video answers stay short?

    86.1%

    of video answers ended within a minute

    86.1% of 1,150 measured video answers lasted 60 seconds or less, 55.2% lasted 30 seconds or less, and 13.9% ran longer than a minute.

    Duration was measured for 67.1% of video answers.

    Read it right: Short is not empty: a one-minute answer carries far more words than a typed reply, plus tone and expression. When answers stay short, look at the question and the one before it first.

    See the data
  5. 05How long do people talk in a video answer?

    26 s

    median video answer

    The median video answer lasted 26 seconds across 1,150 measured answers, and the middle half ran from 13 to 46 seconds.

    Calculated across all 1,150 measured answers; your own forms may differ.

    Read it right: Length follows the question. A broad question, or one sent to people with little to say, gets a short reply; a specific, descriptive one invites more. And speech fits several times more words into the same seconds than typing on a phone.

    See the data
  6. 06How long does a form take to finish?

    1 min 52 s

    median form time, across forms of every length

    The median completed form took 1 minute 52 seconds from start to submission (1,753 timed responses); the slowest 10% took over 19 minutes.

    Elapsed time, including reading, pauses and idle tabs; timing covered 58.3% of completed responses.

    Read it right: This median mixes very different forms, and most completed responses had no video answer. A form with ten video questions needs far longer: ten answers at the 26-second median are over four minutes of recording alone.

    See the data
The study

A focused study, built around those six questions

We kept only classical RecRam forms, set aside internal and non-production forms, and counted each unit separately, because a response, an answer and a video are not the same thing.

  1. 8,058

    form responses

    from 400 classical forms

  2. 3,008

    completed responses

    the base for every answer-level figure

  3. 3,564

    recorder answers

    video, text, upload or voice

  4. 1,713

    video answers

    in 768 responses · 141 forms

  5. 1,150

    timed video answers

    67.1% of video answers

Classical forms only. Conversational forms, website widget captures, video messages and showcase views are out of scope. They have different entry points and completion rules, and mixing them would blur every number.

Cleaned before counting. Deleted records, internal accounts and non-production forms were removed before a single number was calculated.

Records, not people. One person can leave several records, and a completed record holds several answers. We never relabel records as unique respondents.

01When a form lets people record, do they?

1 in 3 answers to a recording question were typed, not recorded

Video accounted for 48.1% of 3,564 answers to recording-type questions in completed RecRam form responses; 32.0% were typed text, 12.3% file uploads and 3.8% voice.

Observed mix, not a preference test: the options offered differed between forms.

Video was the most common answer to a recording question, but not by a landslide. Almost a third of answers were typed, 437 arrived as uploaded files, and voice, at 3.8%, was the least used of the four.

The same holds at the response level: 1,763 completed responses answered a recording question in some way, but 768 of them (43.6%) included a video. A form that can collect video produces plenty of responses without one.

Why it matters
Calling every recorder answer a “video response” would roughly double the real video count. People treat a recording question as a choice of formats, and typing was the second most common.
What to do
Keep a text option when participation matters more than format. Report video, voice, text and uploads separately, and compare the mix only between versions of the same form.
How recorder answers were storedOf 3,564 nonempty answers to recording-type questions in completed RecRam form responses, video 48.1%, text 32.0%, file upload 12.3%, voice 3.8%, unclassified 3.9%.How recorder answers were stored3,564 nonempty answers to recording-type questions in completed responsesVideo1,713 answers48.1%Text1,139 answers32.0%File upload437 answers12.3%Voice136 answers3.8%Unclassified139 answers3.9%Each square ≈ 1% of answersSource: RecRam Research (2026) · recram.com/research/video-form-response-statistics
Figure 1. Stored mode of 3,564 nonempty recorder answers in 3,008 completed responses. Uploads stay a separate category; unlabeled answers stay unclassified rather than guessed.
Data table
ModeAnswersShare
Video1,71348.1%
Text1,13932.0%
File upload43712.3%
Voice1363.8%
Unclassified1393.9%

Denominator: 3,564 answers. Shares rounded independently.

Embed or download this chart

Free to reuse with credit. Paste this into your page; the caption link is the attribution.

<figure style="margin:0;max-width:720px"><img src="https://recram.com/research/video-form-response-statistics/charts/recorder-modes.svg" alt="Waffle chart: 48.1% video, 32.0% text, 12.3% file upload, 3.8% voice, 3.9% unclassified among 3,564 recorder answers." width="720" height="444" style="width:100%;height:auto" loading="lazy"><figcaption style="font-size:13px">Source: <a href="https://recram.com/research/video-form-response-statistics">RecRam Research, The State of Multimodal Form Responses 2026</a></figcaption></figure>
SVG (720×444)
02Do people record on a phone or a computer?

Your respondents’ recording studio is a phone

Of 615 completed responses containing video where the device could be classified, 74.1% were recorded on a mobile device.

Device was known for 80.1% of video responses; across all 768, mobile was 59.4%.

Three in four video responses with a known device were recorded on a phone. Counting all 768 video responses, including the 20.2% whose device was unknown, mobile still accounts for 59.4%, nearly three times desktop’s 20.4%.

These figures cover completed responses only, so they show where finished video answers were recorded, not how many people gave up on each device.

Why it matters
For most people the phone is the whole experience: the camera permission prompt, framing a selfie video, uploading on mobile data and finding the way back to the form.
What to do
Test every video question on a phone before you send it. Keep questions readable on a small screen, make re-recording obvious, and track upload failures directly.
Most video responses came from phonesOf 768 completed responses containing video: mobile 59.4%, desktop 20.4%, other or unclassified 20.2%. Among the 615 with a classified device, 74.1% were mobile.Most video responses came from phones768 completed responses containing at least one video answerAll 768 video responsesMobile59.4% · 456Desktop20.4% · 157Other or unclassified20.2% · 155The 615 where the device was knownMobile 74.1%Desktop 25.5% · other 0.3%Device known for 80.1%Source: RecRam Research (2026) · recram.com/research/video-form-response-statistics
Figure 2. Device class of 768 completed responses containing video, from the stored user agent. Other devices and missing data are combined.
Data table
DeviceResponsesShare of allShare of known
Mobile45659.4%74.1%
Desktop15720.4%25.5%
Other (tablet)20.3%0.3%
Unclassified15319.9%—

Device known for 615 of 768 (80.1%).

Embed or download this chart

Free to reuse with credit. Paste this into your page; the caption link is the attribution.

<figure style="margin:0;max-width:720px"><img src="https://recram.com/research/video-form-response-statistics/charts/video-devices.svg" alt="Stacked bars: of 768 video responses, 59.4% mobile, 20.4% desktop, 20.2% other or unclassified; 74.1% mobile among the 615 with a known device." width="720" height="400" style="width:100%;height:auto" loading="lazy"><figcaption style="font-size:13px">Source: <a href="https://recram.com/research/video-form-response-statistics">RecRam Research, The State of Multimodal Form Responses 2026</a></figcaption></figure>
SVG (720×400)
03Will people record more than one answer?

Video is a step in a form, not a single clip

The 768 completed responses that contained video held 1,713 video answers between them, an average of 2.23 each.

An average across answers, so forms with many video questions weigh more.

The 768 completed responses that included video held 1,713 video answers between them, 2.23 on average, spread across 141 forms. On average, a response that included a video included more than two.

Around those recordings sit the quicker fields. A completed response held a median of 4 answered items, a quarter held 6 or more, and one in ten held 10 or more.

Why it matters
A response with video held more than two recordings on average. Every extra video question is another permission check, another upload and another chance to drop out.
What to do
Give each video question a distinct job, put the one you need most first, and let simple facts (names, ratings, choices) stay as quick taps rather than recordings.

768

responses with video

1,713

video answers inside them

Illustration: about 2.2 video answers in each response with video

Answered items per completed response

1

25th

4

Median

6

75th

10

90th

Answered items include contact, consent, choice and rating fields, so they count answers given, not questions shown.

Figure 3. Video answers per video-containing response (768 responses, 141 forms) and answered items per completed response (3,008).
04Do video answers stay short?

86% of video answers end within a minute

86.1% of 1,150 measured video answers lasted 60 seconds or less, 55.2% lasted 30 seconds or less, and 13.9% ran longer than a minute.

Duration was measured for 67.1% of video answers.

Read it right · our interpretation

Short is not empty: a one-minute answer carries far more words than a typed reply, plus tone and expression. When answers stay short, look at the question and the one before it first.

29.2% of answers were done within 15 seconds, 55.2% within 30 seconds and 86.1% within a minute. The remaining 13.9%, about one answer in seven, ran past the minute mark.

Those longer answers matter: about one respondent in seven kept talking past a minute. If your form depends on detail, plan for that group instead of designing every question around the median.

In our experience building forms, much of that comes down to the question. “Any feedback?” invites a sentence; “Tell us about the last time the report took you longer than expected” invites a story. Order matters too: a question answered right after a related one starts from context the respondent has already built, while one that follows an unrelated question starts from zero. And the audience sets the ceiling: people with a recent, relevant experience have more to say.

Why it matters
Most answers stop before the minute mark. Questions that need a full story, a walkthrough or a detailed complaint have to make room for it, or they will get the short version.
What to do
Keep quick questions to about a minute and give story questions two or more. When you want depth, ask on camera and say so: “take a minute or two and walk us through it”. See how to ask for longer answers.
How many video answers ended within a minuteOf 1,150 measured video answers: Up to 15 s 29.2%, 15–30 s 26.0%, 30–60 s 30.9%, Over 60 s 13.9%. 55.2% lasted 30 seconds or less and 86.1% lasted 60 seconds or less.86% of video answers ended within a minute1,150 measured video answers by recorded length0%10%20%30%29.2%Up to 15 s26.0%15–30 s30.9%30–60 s13.9%Over 60 s86.1% within a minute55.2% within 30 sDuration measured for 67.1% of video answersSource: RecRam Research (2026) · recram.com/research/video-form-response-statistics
Figure 4. Share of 1,150 measured video answers by recorded length. Bins include the upper bound.
Data table
LengthAnswersShareCumulative
Up to 15 s33629.2%29.2%
15–30 s29926.0%55.2%
30–60 s35530.9%86.1%
Over 60 s16013.9%100.0%

n = 1,150 measured video answers.

Embed or download this chart

Free to reuse with credit. Paste this into your page; the caption link is the attribution.

<figure style="margin:0;max-width:720px"><img src="https://recram.com/research/video-form-response-statistics/charts/video-answer-length.svg" alt="Column chart of 1,150 video answer durations: 29.2% up to 15 s, 26.0% 15–30 s, 30.9% 30–60 s, 13.9% over 60 s; 86.1% within a minute." width="720" height="410" style="width:100%;height:auto" loading="lazy"><figcaption style="font-size:13px">Source: <a href="https://recram.com/research/video-form-response-statistics">RecRam Research, The State of Multimodal Form Responses 2026</a></figcaption></figure>
SVG (720×410)
05How long do people talk in a video answer?

People say what they have to say in about 26 seconds

The median video answer lasted 26 seconds across 1,150 measured answers, and the middle half ran from 13 to 46 seconds.

Calculated across all 1,150 measured answers; your own forms may differ.

Read it right · our interpretation

Length follows the question. A broad question, or one sent to people with little to say, gets a short reply; a specific, descriptive one invites more. And speech fits several times more words into the same seconds than typing on a phone.

Half the measured answers were 26 seconds or shorter, and the middle half ran from 13 to 46 seconds. The mean, 33 seconds, sits above the median because a share of answers ran much longer; nine in ten stayed within 67 seconds.

Quote the median and the spread together. The median tells you what to expect from most people; the spread tells you how much room the longer answers need.

What fits in 26 seconds: a rough comparison

Spoken, at a conversational pace (upper bound)≈ 71 words
Typed on a phone, at average copy-typing speed≈ 16 words

Recorded answers have pauses and free typing is slower than copying, so read this as a ratio, not a word count: speech fits several times more words into the same seconds, and it carries tone and expression that text does not.

Conversion, not RecRam data: 164 words per minute, Yuan, Liberman & Cieri (2006), Interspeech (turn-wise speaking rate in conversational telephone English); 36.2 words per minute, Palin et al. (2019), MobileHCI (average mobile typing speed of 37,370 volunteers).

Why it matters
A typical answer is the length of a short spoken paragraph: long enough for a reason and an example, short enough to watch in a review queue.
What to do
Size each recording limit to its question and say the length you expect in the question itself. Our video survey question guide has prompts that set scope.
How long video answers lastedAcross 1,150 measured video answers, the median was 26 seconds, the middle half ran 13 to 46 seconds, the mean was 33.18 seconds and 90% lasted 67 seconds or less.Half of video answers were 26 seconds or shorter1,150 measured video answers, recorded length in secondsMedian 26 sMiddle half: 13–46 sMean 33 s90% ≤ 67 s0 s20 s40 s60 s80 sCalculated across all measured answersSource: RecRam Research (2026) · recram.com/research/video-form-response-statistics
Figure 5. Recorded length of 1,150 video answers matched to their question. The box is the middle half; the line runs to the 90th percentile.
Data table
MeasureValue
25th percentile13 s
Median26 s
Mean33.18 s
75th percentile46 s
90th percentile67.34 s

n = 1,150 of 1,713 video answers (67.1% coverage).

Embed or download this chart

Free to reuse with credit. Paste this into your page; the caption link is the attribution.

<figure style="margin:0;max-width:720px"><img src="https://recram.com/research/video-form-response-statistics/charts/video-answer-spread.svg" alt="Range chart of 1,150 video answer durations: median 26 s, middle half 13 to 46 s, 90% within 67 s." width="720" height="330" style="width:100%;height:auto" loading="lazy"><figcaption style="font-size:13px">Source: <a href="https://recram.com/research/video-form-response-statistics">RecRam Research, The State of Multimodal Form Responses 2026</a></figcaption></figure>
SVG (720×330)
06How long does a form take to finish?

Form time follows the form: the median is about two minutes

The median completed form took 1 minute 52 seconds from start to submission (1,753 timed responses); the slowest 10% took over 19 minutes.

Elapsed time, including reading, pauses and idle tabs; timing covered 58.3% of completed responses.

Read it right · our interpretation

This median mixes very different forms, and most completed responses had no video answer. A form with ten video questions needs far longer: ten answers at the 26-second median are over four minutes of recording alone.

The median completed form took 1 min 52 s, but that single number mixes very different forms: one-question check-ins, multi-step surveys and recorded interviews. Half of completed responses had 4 answered items or fewer, and 2,240 of the 3,008 completed responses contained no video answer at all.

So read it as a floor, not a promise. A form with ten video questions cannot be finished in two minutes; the recording time alone adds up quickly, before anyone reads a question, thinks, re-records or waits for an upload.

Recording time alone, by number of video questions

Illustration: questions × the 26-second median answer. Reading, thinking and uploading come on top.

1 question
26 s
3 questions
1 min 18 s
5 questions
2 min 10 s
10 questions
4 min 20 s

Across all timed forms, the middle half took 44 seconds to 7 min 22 s and the slowest tenth more than 19 minutes, which pulls the mean up to 6 min 20 s. This is elapsed time, not effort: it includes reading, watching a host video, recording, uploading and leaving a tab open.

Why it matters
An invitation that promises “two minutes” for a ten-question video form sets people up to quit halfway. The honest estimate comes from your own form, not from a platform median.
What to do
Estimate time per form: count the video questions, allow about a minute for each, and add the rest. Then check your own median after the first responses and update the invitation.
How long a completed form tookAcross 1,753 completed responses with valid timing, median elapsed time was 1 min 52 s, the middle half took 44 seconds to 7 min 22 s, the 90th percentile was about 19 minutes and the mean was 6 min 20 s.How long a completed form tookStart to submission, 1,753 completed responses (log scale)Median 1 min 52 sMean 6 min 20 sSlowest 10%: 19 min+Fastest 10%: 23 s10 s30 s1 min2 min5 min10 min30 min1 hTiming covers 58.3% of completed responsesSource: RecRam Research (2026) · recram.com/research/video-form-response-statistics
Figure 6. Elapsed time from form session start to completion for 1,753 completed responses with a valid timing of one hour or less. Log scale.
Data table
PercentileElapsed time
10th23 s
25th44 s
Median1 min 52 s
75th7 min 22 s
90th19 min 8 s
Mean6 min 20 s

Timing covers 58.3% of completed responses.

Embed or download this chart

Free to reuse with credit. Paste this into your page; the caption link is the attribution.

<figure style="margin:0;max-width:720px"><img src="https://recram.com/research/video-form-response-statistics/charts/form-completion-time.svg" alt="Log-scale range chart of form elapsed time: median 1 min 52 s, middle half 44 s to 7 min 22 s, 90th percentile about 19 minutes." width="720" height="360" style="width:100%;height:auto" loading="lazy"><figcaption style="font-size:13px">Source: <a href="https://recram.com/research/video-form-response-statistics">RecRam Research, The State of Multimodal Form Responses 2026</a></figcaption></figure>
SVG (720×360)
How to ask

Seven ways to get longer, better answers

Most answers end within a minute. When you need more, the question has to ask for it. These are RecRam’s recommendations from building video forms; how questions were asked was not measured in this study.

  1. 1

    Ask the people who have something to say.

    Send the question to people with a recent, relevant experience: a customer who just finished onboarding, a candidate who applied this week. Distance from the moment shortens the answer.

  2. 2

    Ask on camera.

    Record the question as a short video. Your tone, pace and length show respondents what kind of answer you expect, which a line of text cannot do.

  3. 3

    Ask one thing at a time.

    A question with two parts gets half an answer. Split it, and give each part its own recording.

  4. 4

    Say how long to talk.

    “Take a minute or two” or “about 30 seconds is plenty” sets the scope before the camera starts.

  5. 5

    Warm up before the big question.

    Earlier questions set the context. A quick, easy question first and the story question after it gets a respondent talking from somewhere, not from zero.

  6. 6

    Give them a moment to start from.

    Prompts like “think of the last time you…” or “walk us through…” turn a yes-or-no question into a story.

  7. 7

    Set the limit above what you ask for.

    If you ask for a minute, allow two. A recording that cuts off mid-sentence teaches people to rush the next one.

  8. Next on our list: comparing answer length for questions asked on video with questions asked in text, on the same forms. If you want to be notified when that edition is out, tell us.
For your team

What the findings mean for your team

Practical takeaways by role. The study has no hiring- or testimonial-specific benchmark, so each one applies the general findings rather than a niche number.

Hiring and HR

one-way video interviews

  • Size each recording limit to its question: most measured answers ended within a minute (median 26 s).
  • Assume candidates record on a phone, and run the whole interview on one before you send it.
  • Expect more than one recording per candidate: responses with video held 2.23 on average.
Async video interviews

CX and support

video feedback surveys

  • Offer text beside video: a third of recorder answers (32.0%) were typed.
  • Report video, voice and text separately instead of “video responses”.
  • Estimate time from your own form: count the video questions and allow about a minute for each, plus reading time.
Video surveys

Marketing

customer video testimonials

  • Record your question on camera and name the length you want: 86.1% of answers ended within a minute, so ask explicitly when you need more.
  • Write phone-first recording tips: 74.1% of video responses with a known device came from phones.
  • Count usable clips, not submissions.
Video testimonials

UX and product research

recorded user feedback

  • Ask one thing per question: half of measured answers were 26 seconds or less.
  • Code answers with a documented method; length and volume do not measure insight.
  • When you benchmark, publish the sample size and coverage beside the median.
Customer feedback analysis
Patterns in the data

Four patterns behind the averages

Patterns drawn from the same aggregates, with no customer names.

The quick-answer half

  • 635 clips
  • 55.2% of answers
  • within 30 s

More than half of measured answers were done within 30 seconds, and three in ten within 15. For quick check-in questions, a short recording limit keeps the form moving.

The long-form minority

  • 160 clips
  • 13.9% of answers
  • 90th percentile 67 s

About one answer in seven ran past a minute. Answers like these are why recording limits should be set per question rather than to the median.

Phone-first respondents

  • 456 mobile responses
  • 74.1% of known devices
  • 59.4% of all

Phones lead even when every video response is counted, including those whose device was unknown: 59.4% mobile against 20.4% desktop. The recording experience on a phone is the one most respondents get.

Multi-question video forms

  • 768 responses
  • 1,713 video answers
  • 2.23 per response

Video sits among other questions: responses with video held 2.23 video answers on average, and a completed response held a median of 4 answered items.

Reading the numbers

Three rules for reading any form statistic

  1. 1

    Completed is not converted.

    3,008 of 8,058 stored form responses (37.3%) were marked completed; the rest were saved partial responses. Not a conversion rate: the denominator is stored responses, not visitors or sessions. RecRam keeps partial responses, so a partial record can be a paused session, a technical failure or someone who stopped.

  2. 2

    Records are not people.

    One person can leave several records and one record holds several answers. A study that calls records “respondents” is counting the wrong thing.

  3. 3

    Coverage travels with the number.

    A median from 67.1% timing coverage is a different number from a fully covered one, and a platform-wide median is not a target for any single form. Say so next to the number, not in an appendix.

Stored responses at extraction

3,008 completed (37.3%)5,050 partial

What a real form conversion funnel needs

One cohort, one unit, the same bot and preview rules at every stage:

  1. Unique form sessions

    not page views; repeat loads and previews removed

  2. Starts

    a respondent interacted with the first question

  3. Accepted answers

    per question, so drop-off is visible step by step

  4. Submission attempts

    including failed uploads and retries

  5. Successful submissions

    the numerator of a real conversion rate

Methodology

How the data was built

Read-only aggregation of RecRam response metadata, extracted on 12 October 2026. Descriptive and observational: no experiment, no randomized assignment.

Exclusion flow

Sequential; each record is counted at its first matching rule.

  1. Stored classical form responses before the cutoff11,434
  2. Deleted or unlinked answers, forms and organizations−1,9089,526
  3. Internal and non-production forms−1,4198,107
  4. Responses with no stored answer−498,058

Definitions

Response record
A stored classical form response. Not a unique person.
Completed record
A record whose completion flag was true at extraction.
Recorder answer
A nonempty answer to a recording-type question, stored as video, text, voice or upload.
Video duration
Recorded length from recorder metadata, matched to the answer by response, question and video mode. Positive values up to 30 minutes kept.
Form elapsed time
Front-end session time from start to completion. Values over one hour excluded from the summary.
Percentiles
Linear interpolation at index (n − 1) × p.
Limitations
  • Retained data only. Deleted responses, forms and accounts are excluded.
  • Residual internal use. Internal accounts and non-production forms are removed, but some unlabeled internal use may remain.
  • Platform-wide figures. Every figure pools all eligible responses, so it describes the platform as a whole rather than a typical form.
  • Completed responses only. Answer-level, device and timing figures come from completed responses; people who stopped partway are not in them.
  • Repeated observations. Records are not deduplicated people and are not independent survey respondents.
  • Missing telemetry. Timing and device coverage differ by subset and were not imputed.
  • Offered options unknown. Which answer modes and limits each respondent saw was not reconstructed.
  • No outcomes. Nothing here measures answer quality, satisfaction, hiring or purchase outcomes, or conversion.
  • No population inference. Not a probability sample; no confidence intervals or causal claims.

Data source and privacy

Records come from RecRam’s production database through read-only queries; no application code or data was changed. The cohort includes eligible records created before the 12 October 2026 cutoff, starting from the earliest retained record in March 2024. Completion flags and deletion states reflect the extraction snapshot.

Published files contain totals, distributions and summary statistics only: no response content, recordings, transcripts, names, emails, IP addresses, raw user agents or account identifiers. The query logic is kept internally so an authorized analyst can reproduce every figure.

FAQ

Questions about this research

How long is a typical video answer in a video form or video survey?

In RecRam’s 2026 study, the median video answer lasted 26 seconds across 1,150 measured answers, the middle half ran 13 to 46 seconds, and 86.1% were 60 seconds or shorter. These are platform-wide figures, not a target for every form.

Do people answer video surveys on their phones?

Mostly, among completed responses. Of the 615 completed video-containing responses whose device could be classified, 74.1% came from a mobile device. Device was unknown for about 20% of video-containing responses, so across all 768 the mobile share was 59.4%.

When a form allows video, do people actually record video?

About half the time. Video made up 48.1% of 3,564 answers to recording-type questions; typed text made up 32.0%, file uploads 12.3% and voice 3.8%. The options available differed between forms, so this is an observed mix rather than a measured preference.

How many video responses did RecRam analyze?

1,713 video question answers across 768 completed responses and 141 forms. Duration analysis used the 1,150 of them with usable timing. The full study covers 8,058 stored form responses of all answer types, not 8,058 videos.

Why are some video answers short?

This study did not measure the cause, but in our experience it is usually the question or the audience rather than the format. Broad questions, questions sent to people without a recent relevant experience, and questions that come straight after an unrelated one tend to get brief replies. Even a short reply carries a lot: published measurements put conversational speech at about 164 words a minute and average phone typing at about 36, so speech fits several times more words into the same seconds. Recorded answers include pauses, so treat that as a rough ratio rather than a measurement of RecRam answers.

How long does a video form take to complete?

It depends on how many questions it asks. Across every form in the study the median completed form took 1 minute 52 seconds, but that mixes one-question forms with multi-step ones, and most completed responses contained no video answer. Ten video questions at the 26-second median answer length are over four minutes of recording before any reading, thinking or uploading.

How do I get longer, more detailed video answers?

This study did not measure question wording, so this is RecRam’s recommendation rather than a finding: record the question on camera, ask one specific thing, say how long you would like people to talk, and set the recording limit above that length. In the study, 86.1% of measured answers ended within a minute, so ask explicitly when you want more.

Does this study show that video forms convert better than text forms?

No. The data describe which answer types were stored, not a randomized comparison. They cannot establish a completion lift, a preference for video, or a difference in answer quality.

Is 37.3% the completion rate of a video form?

No. 37.3% is the share of stored response records that were marked completed (3,008 of 8,058). A conversion rate needs visitors or sessions as its denominator, which this study does not use.

Can I use these numbers in my own article or deck?

Yes. Quote the number with its sample size and caveat, credit RecRam Research and link to this page. The charts can be embedded with the code in the “Cite and reuse” section.

Cite & reuse

Use these numbers. Bring the caveats.

Charts and aggregate data are free to reuse under CC BY 4.0: credit RecRam Research and link to this page. Keep the sample size and the caveat with each figure.

Citation (APA)

RecRam Research. (2026). The State of Multimodal Form Responses 2026: A study of 8,058 retained form response records (Version 1.0). RecRam. https://recram.com/research/video-form-response-statistics

Short credit line

Source: RecRam Research, The State of Multimodal Form Responses 2026 (recram.com/research/video-form-response-statistics)

Example of a complete quote

RecRam's October 2026 platform study found that 86.1% of 1,150 measured video answers lasted a minute or less, with a median of 26 seconds.

Embed the infographic

<figure style="margin:0;max-width:1080px"><img src="https://recram.com/research/video-form-response-statistics/charts/key-numbers-infographic.svg" alt="Infographic of six key numbers from RecRam’s 2026 study of 8,058 form responses: 48.1% video, 26-second median, 74.1% phones, 2.23 video answers per response, 1 min 52 s per form, 86.1% of video answers within a minute." width="1080" height="1350" style="width:100%;height:auto" loading="lazy"><figcaption style="font-size:13px">Source: <a href="https://recram.com/research/video-form-response-statistics">RecRam Research, The State of Multimodal Form Responses 2026</a></figcaption></figure>